Functional connectivity mapping, or resting state analysis is a popular technique for fMRI analysis in humans. Instead of evoking blood flow responses in the brain using specific stimuli, subjects simply rest while fMRI data is acquired throughout the brain. Baseline fluctuations in blood flow are observed throughout the brain in this resting state. While these fluctuations typically appear random on a local level, it was noted that correlations in these fluctuations could be observed within spatially separated brain regions. Regions found to be strongly correlated (or anti-correlated) are inferred to have some form of functional connection, either directly between each other, or as a result of a common connection to another brain region. Not only do these results suggest the presence of innate networks within the brain that had not previously been detectable; intriguing results have suggested that these networks, while fairly repeatable in the healthy brain, are affected in a range of pathologies from Alzheimer’s to autism.
Despite the great promise of resting state fMRI however, very little is understood about its underpinning, even whether some or all of the blood flow fluctuations detected are the direct result of local neuronal activity. We are using widefield optical mapping (WFOM) to investigate the interrelation between blood flow, neuronal activity and metabolic changes in the resting brain.
In our recent paper in PNAS, we showed that the awake (and anesthetized) mouse brain exhibits complex, largely symmetric and brain-wide fluctuations in neural activity. We showed that simultaneous fluctuations in hemodynamics can be predicted by these patterns of excitatory neural activity, suggesting that they represent the neural basis of resting state fMRI. We recently received and NIH BRAIN initiative grant to further explore the properties and dependencies of these brain-wide patterns of neural activity in order to improve our ability to interpret resting state fMRI results in humans.
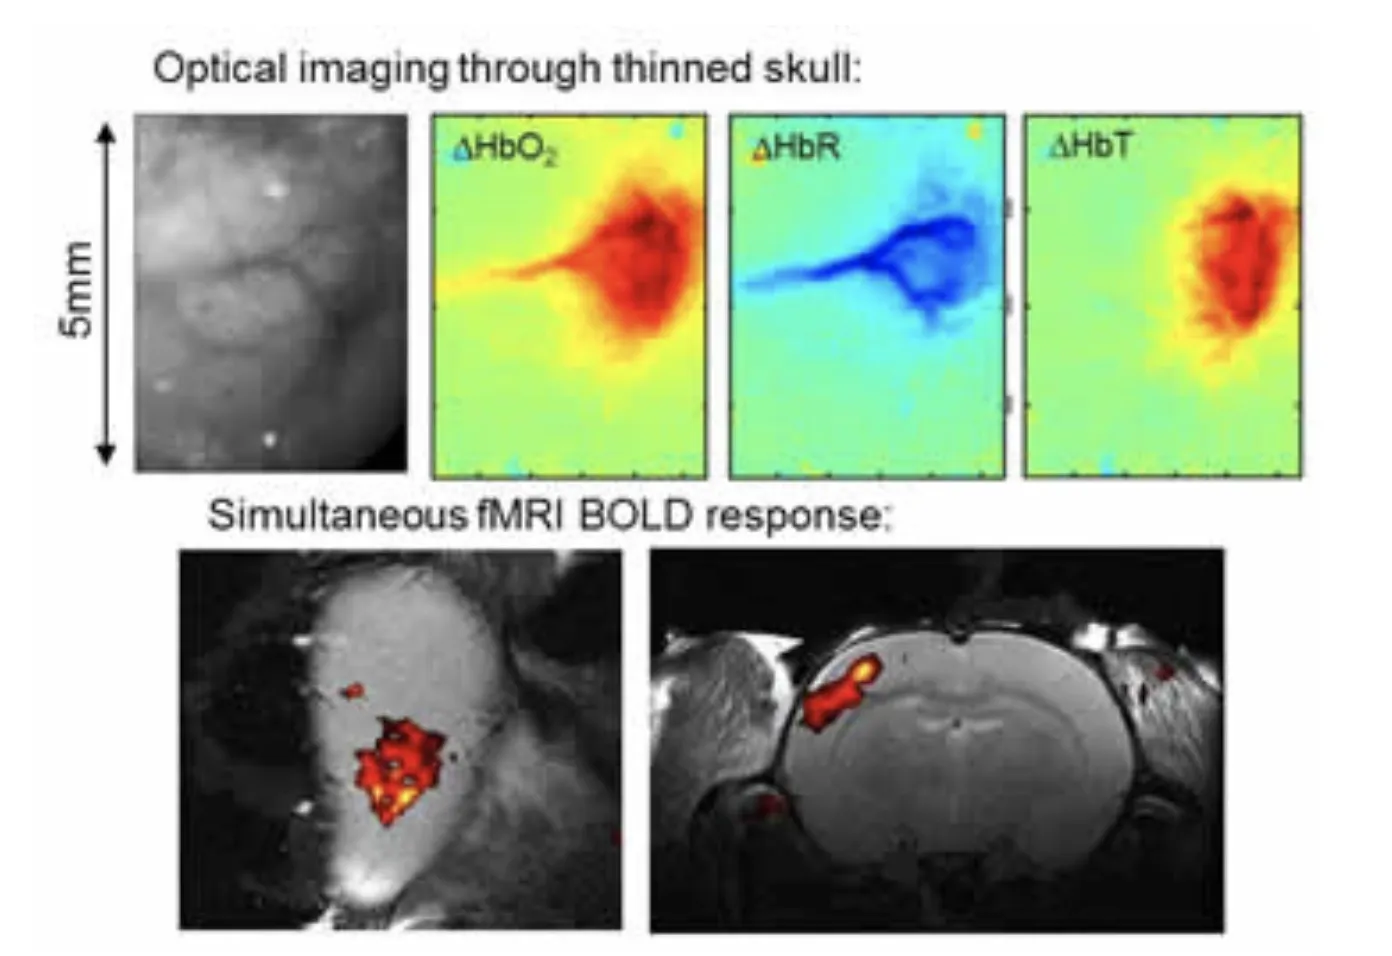
Simultaneous optical imaging and fMRI of responses to somatosensory stimulation. Top row: Optical imaging data was acquired through a fiber optic endoscope positioned to image the thinned skull of a rat undergoing 4 second electrical whisker stimulation during simultaneous acquisition of fMRI data at 4.7T (bottom row). Figure modified from Hillman, 2007.